Hospital AMR Fleet Sizing: Missions, Peaks, Charging and Redundancy
Estimate hospital AMR capacity using mission demand, cycle time, charging, peaks and recovery, with a clearly labelled planning example.
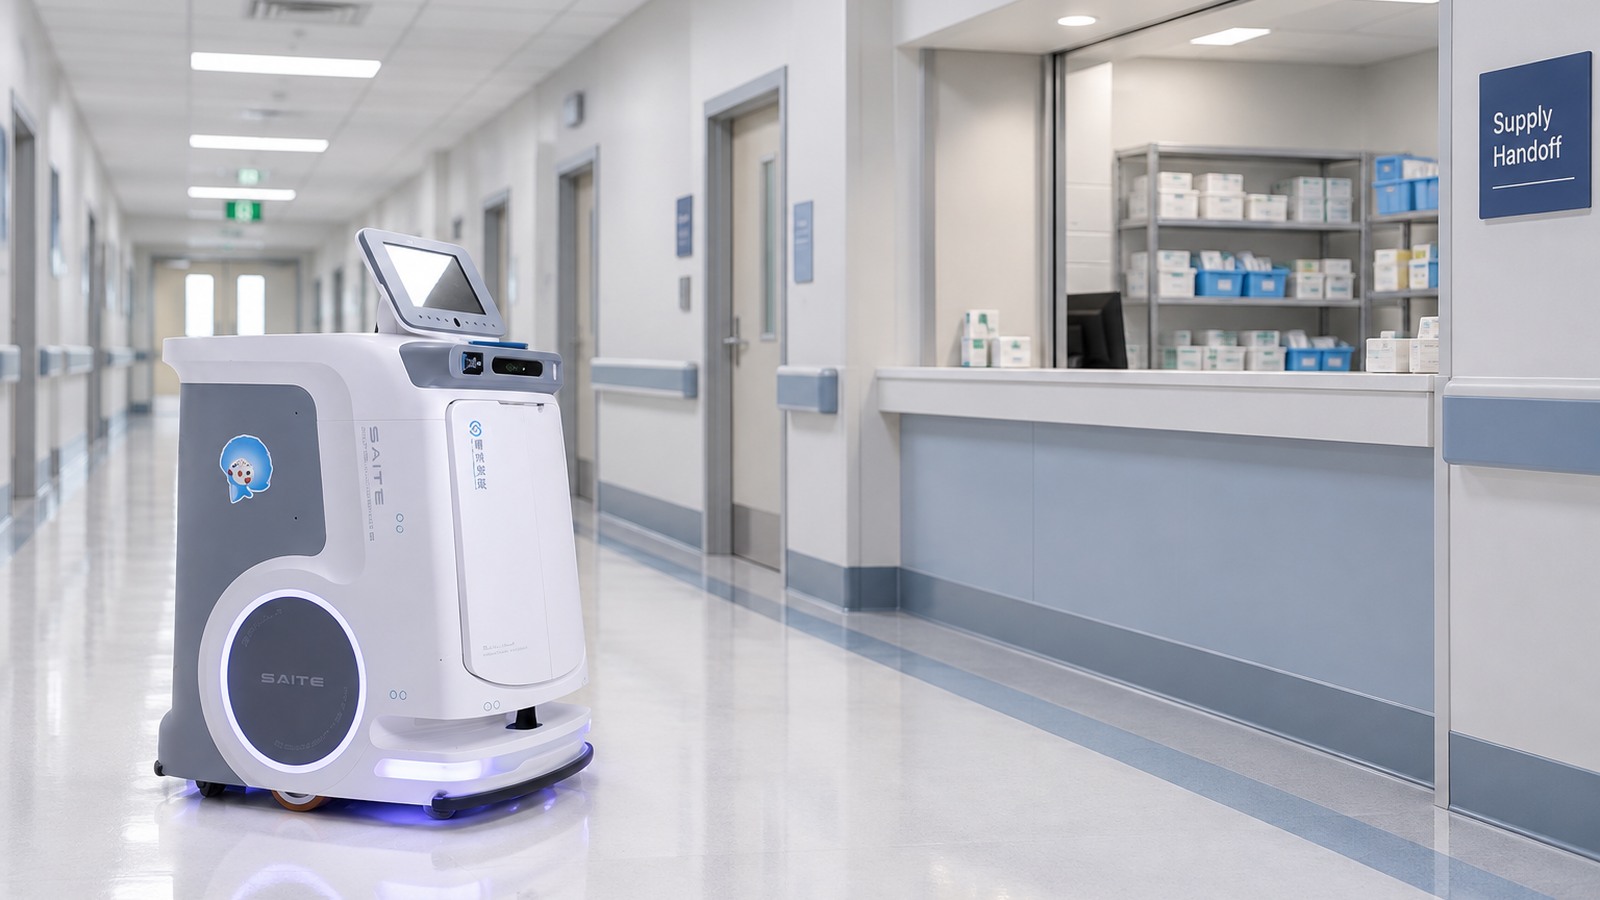
Hospital autonomous mobile robot (AMR) fleet sizing begins with the missions that must be completed within their service windows. Dividing daily deliveries by a nominal robot capacity hides the peaks, elevator queues, handoff delays and unavailable time that constrain a real service. Size the operating system around those constraints, then test the proposed fleet against representative demand.
This guide concerns non-clinical logistics capacity. Clinical priority, infection prevention, payload authorization and emergency operations remain with the hospital’s responsible teams. The broader hospital AMR solution provides the workflow and integration context.
Build demand by service class and time interval
Collect mission requests with origin, destination, release time, required completion window, payload class, handling requirements and receiving availability. Distinguish routine replenishment, scheduled waves and urgent requests. Record which work is eligible for automation and which remains manual.
Use a time interval short enough to expose the actual peak. A daily total can conceal simultaneous requests at shift change or after a distribution round. Preserve the original event timestamps so a later model can replay the pattern instead of smoothing it away.
Keep refused, delayed and manually completed requests in the evidence. Otherwise the measured robot workload can look manageable precisely because staff absorbed the difficult work outside the system.
Measure the complete mission cycle
Include dispatch wait, travel to pickup, loading or collection, loaded travel, door and elevator delay, receiving wait, unloading or release, and repositioning. Identify which steps occupy the robot and which can happen independently. Do not double-count an activity already included in the observed cycle time.
Separate route classes when they have different building dependencies or payload procedures. A short trip with repeated elevator delay may consume more capacity than a longer same-floor route. Manufacturer descriptions, including Aethon’s building integration information, establish that such interfaces are part of some systems; they do not supply a site-specific cycle time.
Use a transparent lower-bound calculation
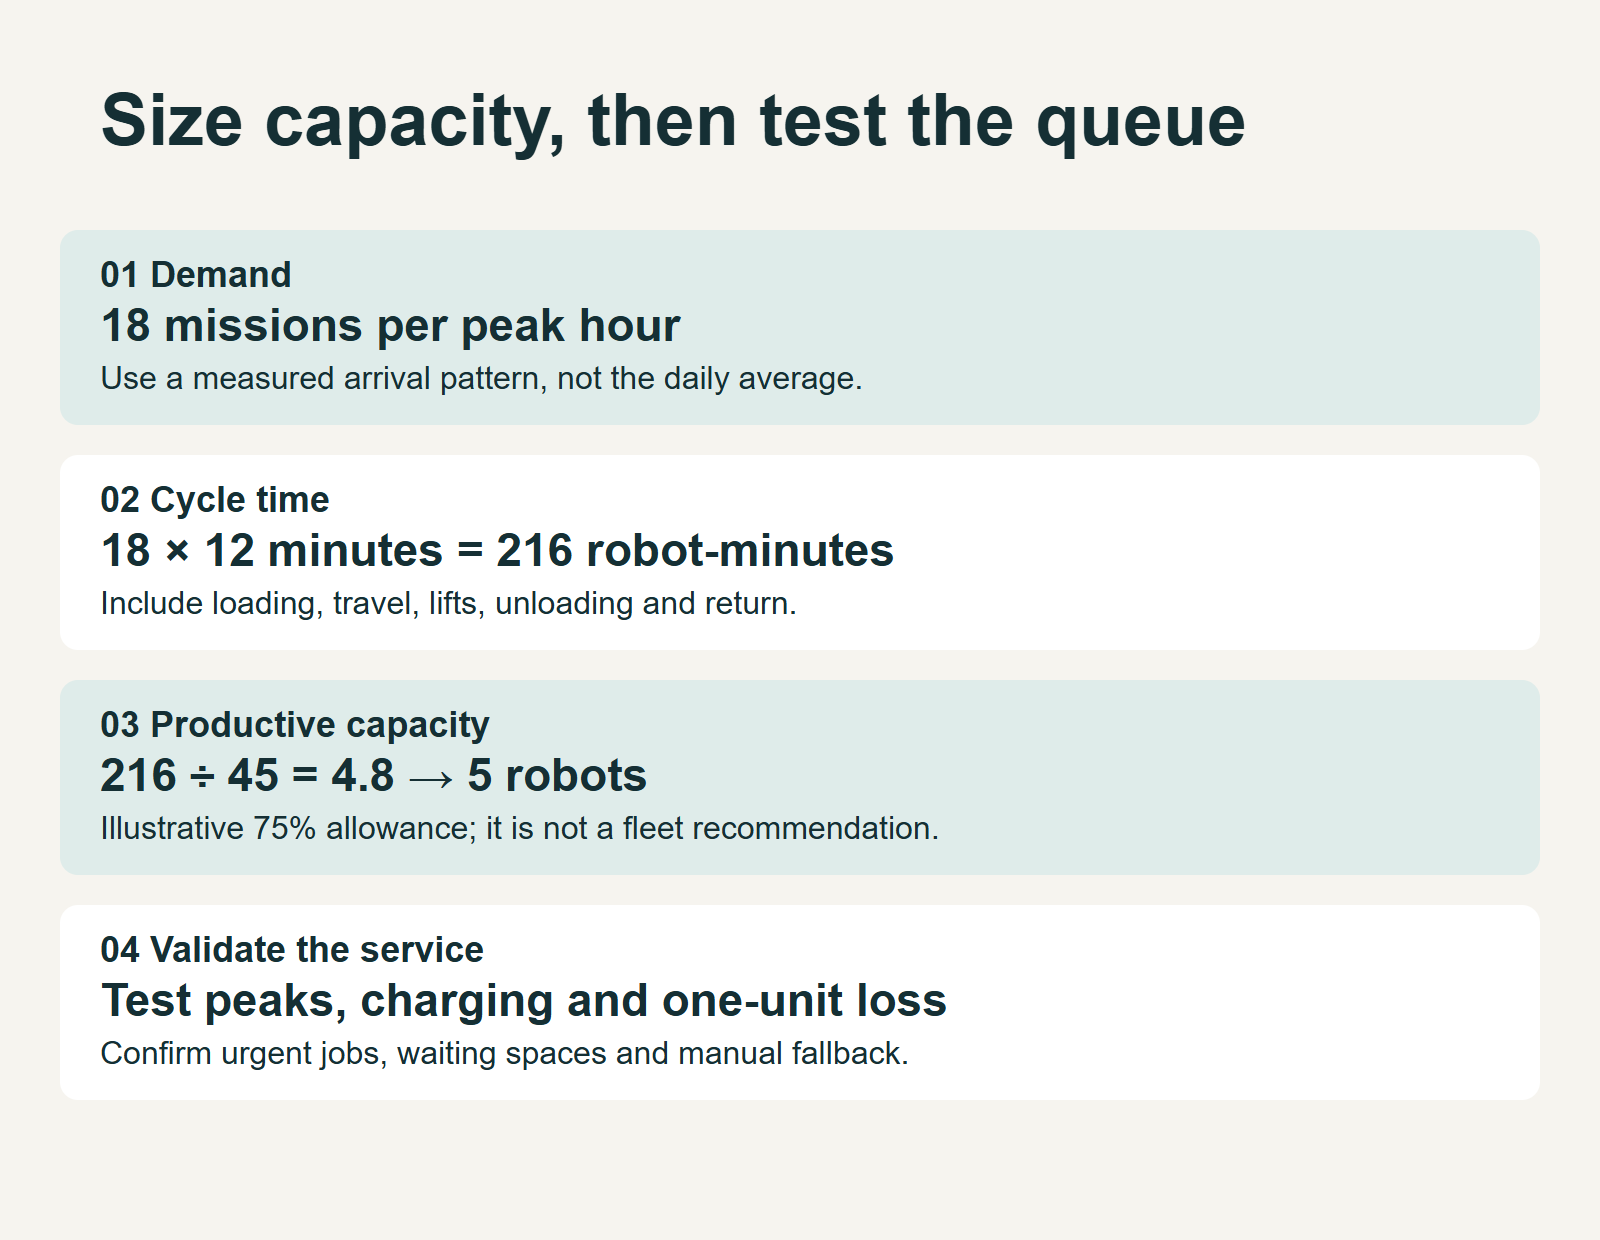
For an initial screening calculation, multiply missions in the peak window by occupied robot minutes per mission. Divide by the minutes in that window to estimate the average number of simultaneously occupied robots. This is a workload lower bound, not a fleet recommendation: it ignores the exact timing of requests and shared-resource contention.
An illustrative one-hour window with 18 missions at 12 occupied minutes per mission contains 216 robot-minutes of work. Dividing by 60 gives 3.6 continuously busy robots. If the planning assumption allows each available robot to spend only 75 percent of that hour on those missions, the screening count is 216 divided by 45, rounded up to five robots.
That 75 percent is an assumption, not a recommended industry utilization target. It must not also cover charging or handoff allowances already included elsewhere. No customer performance is represented by this example.
Test sensitivity before choosing a quantity
Hold the illustrative 18-mission demand and 75 percent planning allowance constant. At 10 occupied minutes per mission, the screening count is four; at 12 minutes, five; at 15 minutes, six. A modest change in the assumed cycle can therefore change the preliminary quantity.
Next change demand and timing, not just cycle duration. Replay overlapping requests, unavailable receivers and lift queues. A fleet that satisfies an average workload calculation may still miss individual deadlines. Use the actual dispatch rules and route priorities in a simulation or controlled pilot before committing to procurement.
Model charging and unavailable states explicitly
Represent charging, cleaning, planned maintenance, incident hold and service recovery as distinct states. Establish energy and reserve requirements from the selected platform’s instructions and observed missions. Do not convert a nominal battery duration into guaranteed shift capacity.
Check charger access as well as charger quantity. A blocked docking area, overlapping charge demand or a robot awaiting cleaning can remove usable capacity. Place these events on the same timeline as peak work rather than subtracting a blanket percentage without explanation.
Use the hospital fleet operating model to align the sizing assumptions with the states operations will actually manage.
Define the redundancy decision by consequence
Test a scenario with one robot unavailable and a separate scenario with a shared dependency unavailable. An additional robot may help the first scenario while doing little for a failed elevator, network segment or receiving process. Identify which missions continue, which can wait and which transfer to manual service.
Avoid claiming that an N-plus-one fleet guarantees continuity. The useful decision is whether the accepted fallback can meet the service priorities during the specific failures the hospital has agreed to plan for.
Validate the proposed fleet in the operating context
Use the hospital pilot acceptance guide to define evidence before the trial. Report request-to-completion time, missed windows, usable capacity, interventions and manually absorbed work alongside mission count. Preserve peak-period results separately from quiet-period averages.
The sizing output should be a range with its demand, cycle, charging, service and fallback assumptions—not just a robot quantity. Bring the mission log and building constraints to a hospital logistics assessment so the fleet proposal can be tested against the work it must support.
The numerical example is an illustrative scenario using editorial assumptions, not measured deployment performance.
Sources and scope
- Aethon T3: Hospital transport platform — Vendor-specific transport and elevator behavior; not evidence that every hospital robot behaves identically.

Iven Wang
Iven Wang is the Co-Founder of Warpify Robotics, specializing in the commercialization and deployment of robotic solutions. With a background in electrical engineering and product management, he works with manufacturers, integrators, and enterprise clients across industrial inspection, security, logistics, and Robotics-as-a-Service.
Subscribe to our newsletter today
Get practical robotics deployment insights, case studies, and planning guidance from Warpify Robotics.