RaaS Revenue Model for Robot Integrators and Local Operators
A modelled RaaS unit-economics and cash-timing framework for integrators and local operators that exposes service cost, utilization and downside risk.
Robotics-as-a-Service can turn a one-time project into a recurring operating relationship. It also moves hardware, uptime and service risk toward the provider. For an integrator or local operator, the question is not simply whether a customer will pay a monthly fee. The question is whether each deployed service cell produces contribution and cash soon enough to fund the next deployment without degrading support.
The International Federation of Robotics defines RaaS for its statistics by an important ownership feature: the robot hardware remains with the supplier. That separates it from a traditional sale and explains why asset recovery, residual value and redeployment belong in the operating model.
Choose the unit of economics before building the spreadsheet
Model the smallest accountable service unit: one robot, one customer site, one workflow bundle or one managed fleet cell. The correct unit is the level at which revenue, hardware, service demand and exit decisions can be traced. Portfolio averages can hide one healthy site subsidizing another.
Define the contracted service envelope beside the financial unit: operating hours, eligible tasks, included support, response coverage, consumables, integrations, change allowance, site obligations and exclusions. A monthly fee with an undefined service boundary is not a usable revenue assumption.
Separate availability, demand and productive service
Do not use one utilization percentage to represent three different questions. Availability asks whether the service was capable of operating in the agreed window. Eligible demand asks whether customer work was actually available. Productive service records accepted tasks or outcomes within the contracted boundary. Keeping the denominators separate prevents low customer demand from being labelled robot downtime and prevents high motion time from being mistaken for customer value.
Build a contribution waterfall, not a revenue chart
The framework below is a Warpify modelled tool. It is an illustrative scenario structure, not Warpify pricing, a market benchmark, accounting advice or an investment recommendation. Finance, tax and legal treatment depends on the contract and jurisdiction.
Scroll horizontally to compare all columns.
| Waterfall line | Include | Common modelling error |
|---|---|---|
| Contracted service revenue | Fixed recurring fee plus defined usage or service charges | Counting unsigned pipeline or pass-through taxes as revenue |
| Hardware recovery | Depreciation, lease, financing or capital-recovery policy | Treating supplier-owned hardware as a zero-cost asset |
| Technology and connectivity | OEM, software, cloud, SIM, mapping and integration fees | Ignoring renewal, minimum or currency exposure |
| Service delivery | Remote operations, field labor, travel, training, spares and logistics | Using only scheduled maintenance and omitting failure demand |
| Contract and risk reserve | Credits, bad debt, insurance, exit, redeployment and change allowance | Assuming every month is steady state |
| Contribution before overhead | Revenue less the above service-cell costs | Calling gross recurring revenue recurring profit |
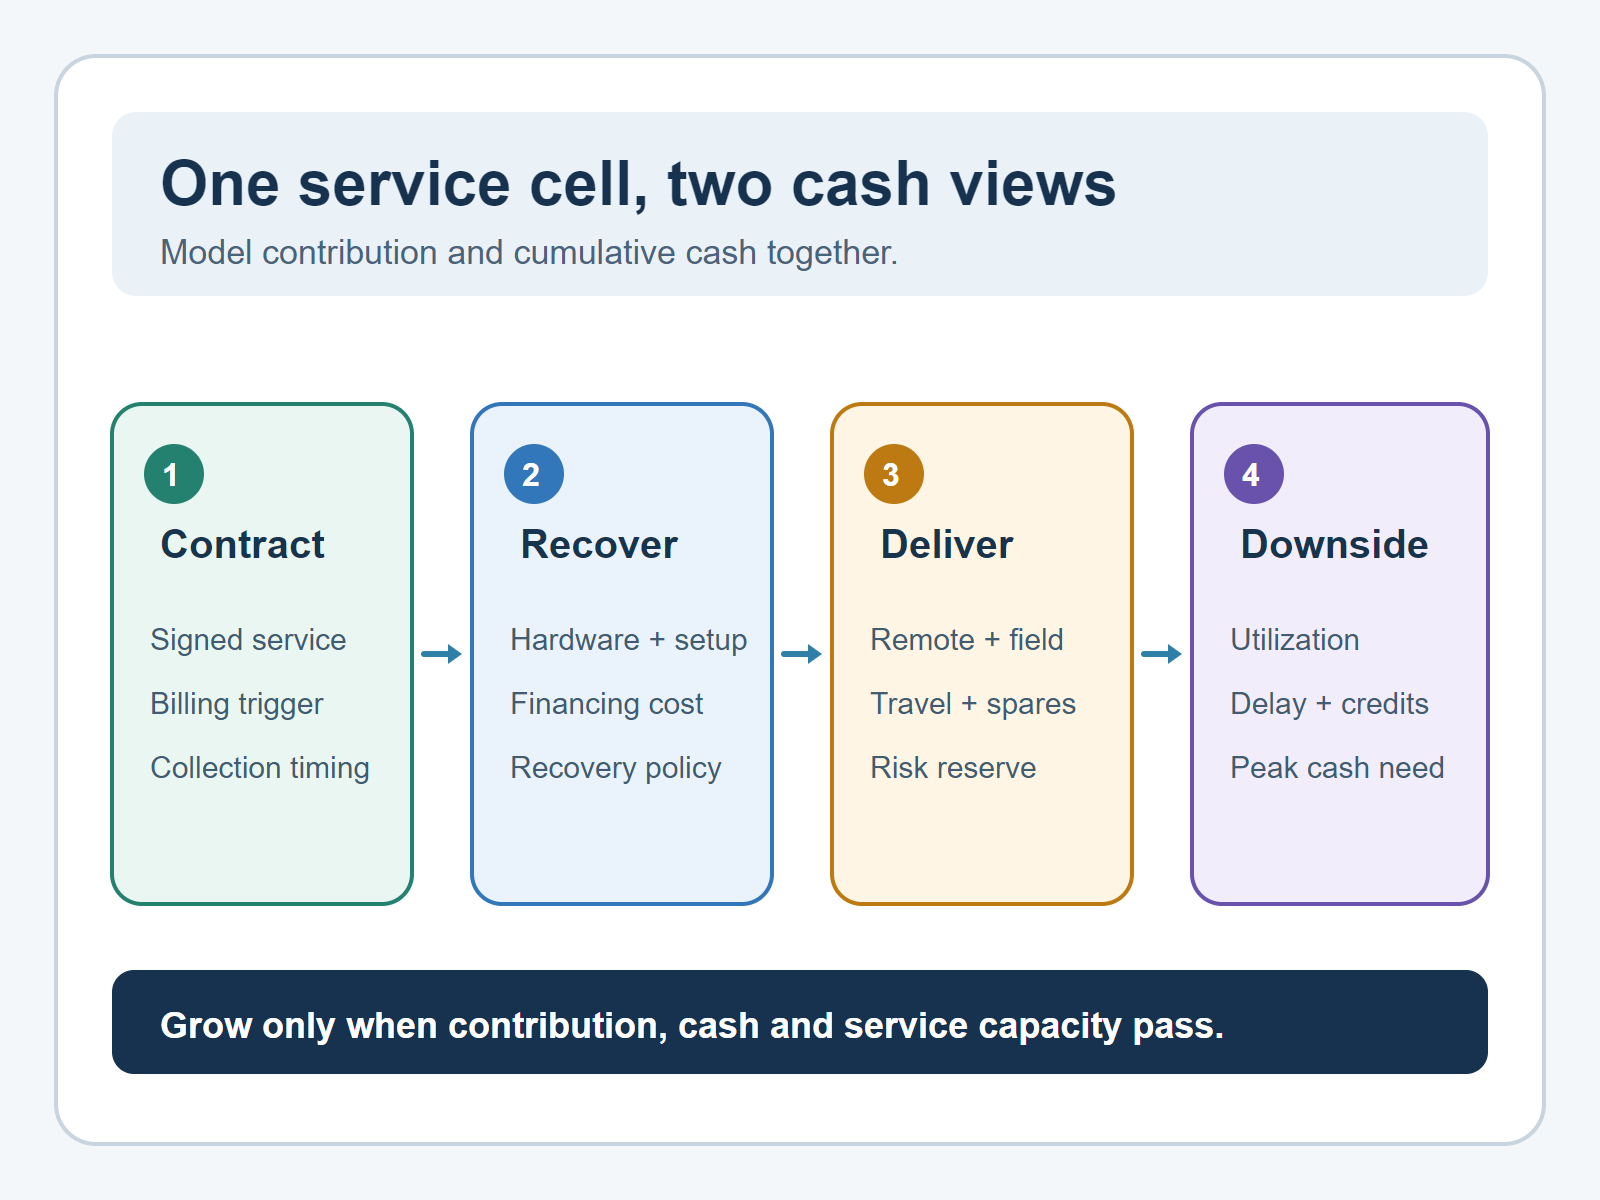
Calculate both steady-state contribution and cumulative cash. A service can show positive accounting contribution after deployment but still consume cash for hardware, integration, commissioning and launch support months before receipts catch up.
Make cash timing visible
Use a deployment-to-recovery bridge. Start with cash paid before go-live: deposits or hardware purchase, integration labor, site work, freight, commissioning, initial spares and training. Then map invoice milestones, payment terms, expected collection delay, recurring operating cost, taxes and any financing draw or repayment. The output should show peak cash exposure, the month of cash recovery under each scenario, and what happens if go-live or collection slips.
A current Richtech Robotics filing provides one company-specific illustration of this timing difference: it describes RaaS service delivered under long-term arrangements with revenue recognized over time, while contract origination and recurring revenue are discussed separately. Do not use that issuer's economics as a benchmark. The useful lesson is structural—signed contract value, recognized revenue, invoicing, cash collection and delivered service are different measures.
Stress the model with operating scenarios
Build downside, base and upside cases from named drivers, not an arbitrary percentage haircut. Useful drivers include go-live date, paid service months, eligible demand, utilization within the contracted envelope, support hours per asset, field visits, travel distance, parts demand, supplier lead time, customer concentration, churn or early exit, collection delay, residual value and redeployment time.
For each driver, identify an evidence source and owner. The downside case should be plausible enough to govern a decision: delayed site readiness, higher-than-planned interventions, one critical part shortage, lower service demand or an early redeployment. If the model survives only when every variable is favorable, the offer is not ready to scale.
Model deployment cohorts as they mature. Launch support, mapping, training and early corrective work are usually concentrated around go-live, while a stable site may require a different service mix. Compare month one, the stabilization period and steady operation instead of spreading every cost evenly. Then test whether the next cohort starts before the previous cohort has released cash and support capacity. This exposes a growth pattern that looks profitable per contract but still overloads field teams or working capital.
Use gates before accepting the next contract
Set four local gates. First, unit contribution: does the deployed cell remain positive after realistic service and risk costs? Second, cash exposure: can the operator fund the peak and recovery period? Third, service capacity: are remote and field teams able to support the installed base plus the new site? Fourth, concentration: would one customer, OEM, part or technician create an unacceptable dependency?
Add a fifth gate when the hardware is supplier-owned: exit and redeployment. Define removal cost, refurbishment, residual configuration, data handling, transport, remarketing and the time before the asset can earn again. A theoretical residual value is not useful if the asset cannot be redeployed economically.
Align the contract with the model
Translate each material assumption into either a provider obligation, a customer obligation, a price mechanism, an exclusion or a change process. Site hours, connectivity, permitted operating conditions, customer staffing, consumables, task volume, response coverage and facility changes should not remain spreadsheet footnotes.
Avoid using utilization alone as the billing proxy. High utilization can increase wear and intervention demand; low utilization may reflect customer demand or site readiness outside the provider's control. Choose commercial measures that the service can observe, explain and govern.
Run one operating review across finance and service
A monthly view should reconcile contracted units, live units, billed units, cash collected, eligible demand, completed service, downtime, remote and field hours, parts consumption, credits, open changes and forecast cash recovery. When finance and service maintain different denominators, apparent margin improvement can simply be missing operational cost.
Combine this model with Warpify's RaaS fleet utilization framework, responsibility matrix and integrator and distributor partner model. If you want to build a locally operated offer, evaluate the partner pathway.

Iven Wang
Iven Wang is the Co-Founder of Warpify Robotics, specializing in the commercialization and deployment of robotic solutions. With a background in electrical engineering and product management, he works with manufacturers, integrators, and enterprise clients across industrial inspection, security, logistics, and Robotics-as-a-Service.
Subscribe to our newsletter today
Get practical robotics deployment insights, case studies, and planning guidance from Warpify Robotics.