RaaS Fleet Utilization and Lifecycle Operations
A RaaS operating model that connects utilization to service demand, availability, maintenance, configuration and lifecycle decisions.
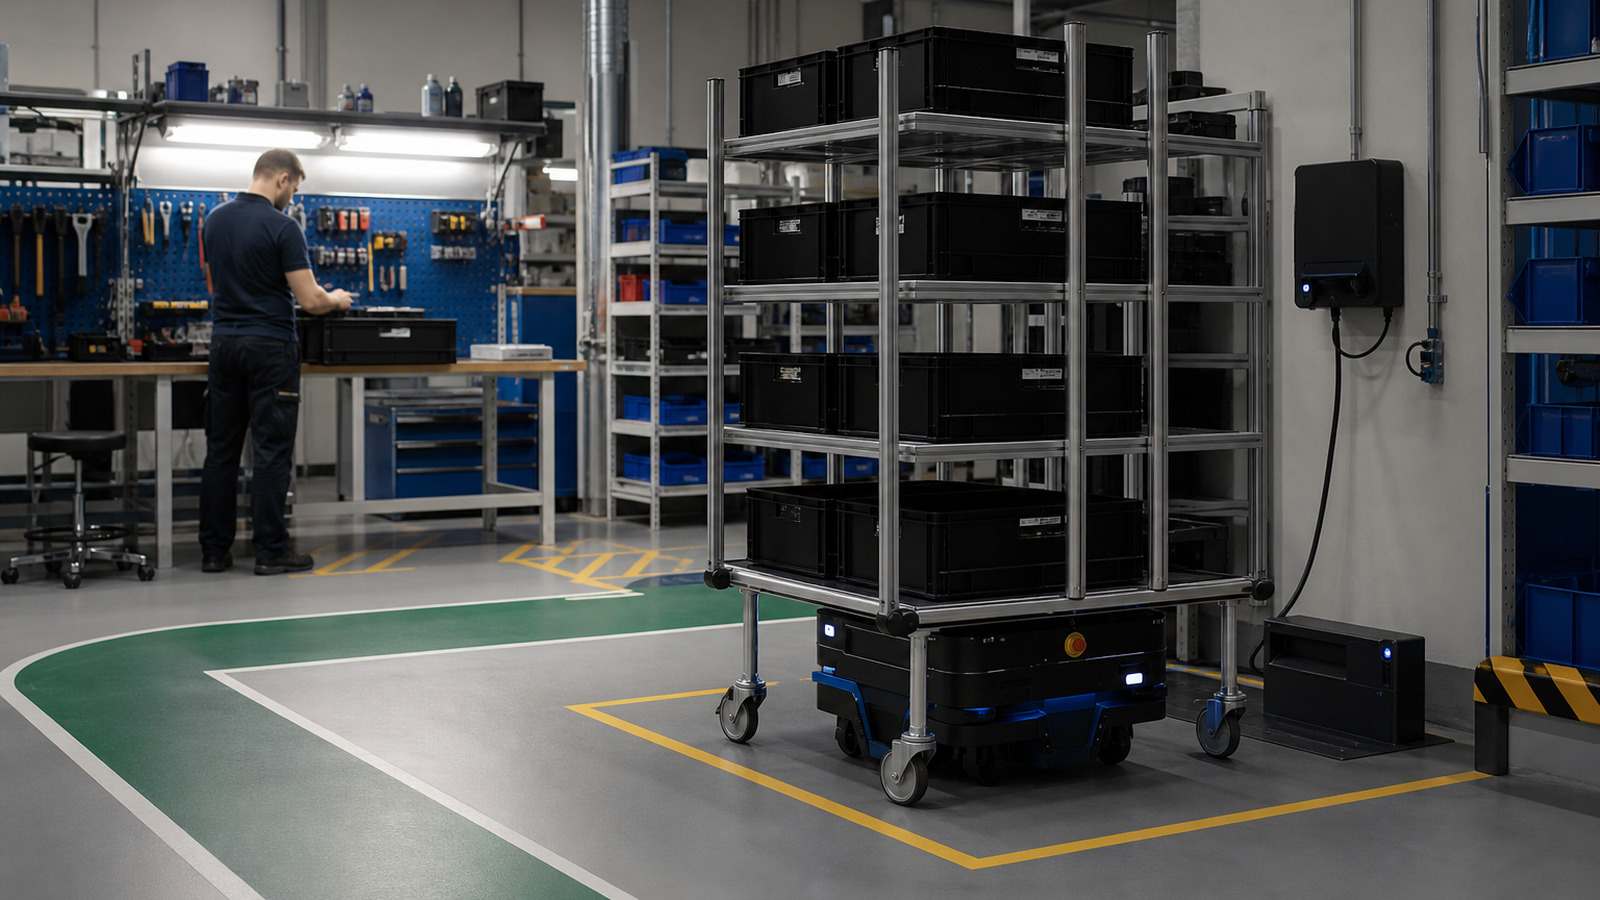
RaaS fleet utilization is easy to calculate badly. Dividing active hours by total hours may make a fleet look inefficient when it is actually preserving peak coverage, charging between service windows or waiting because demand has moved. The same metric can also reward overloading a small fleet until availability and maintenance deteriorate.
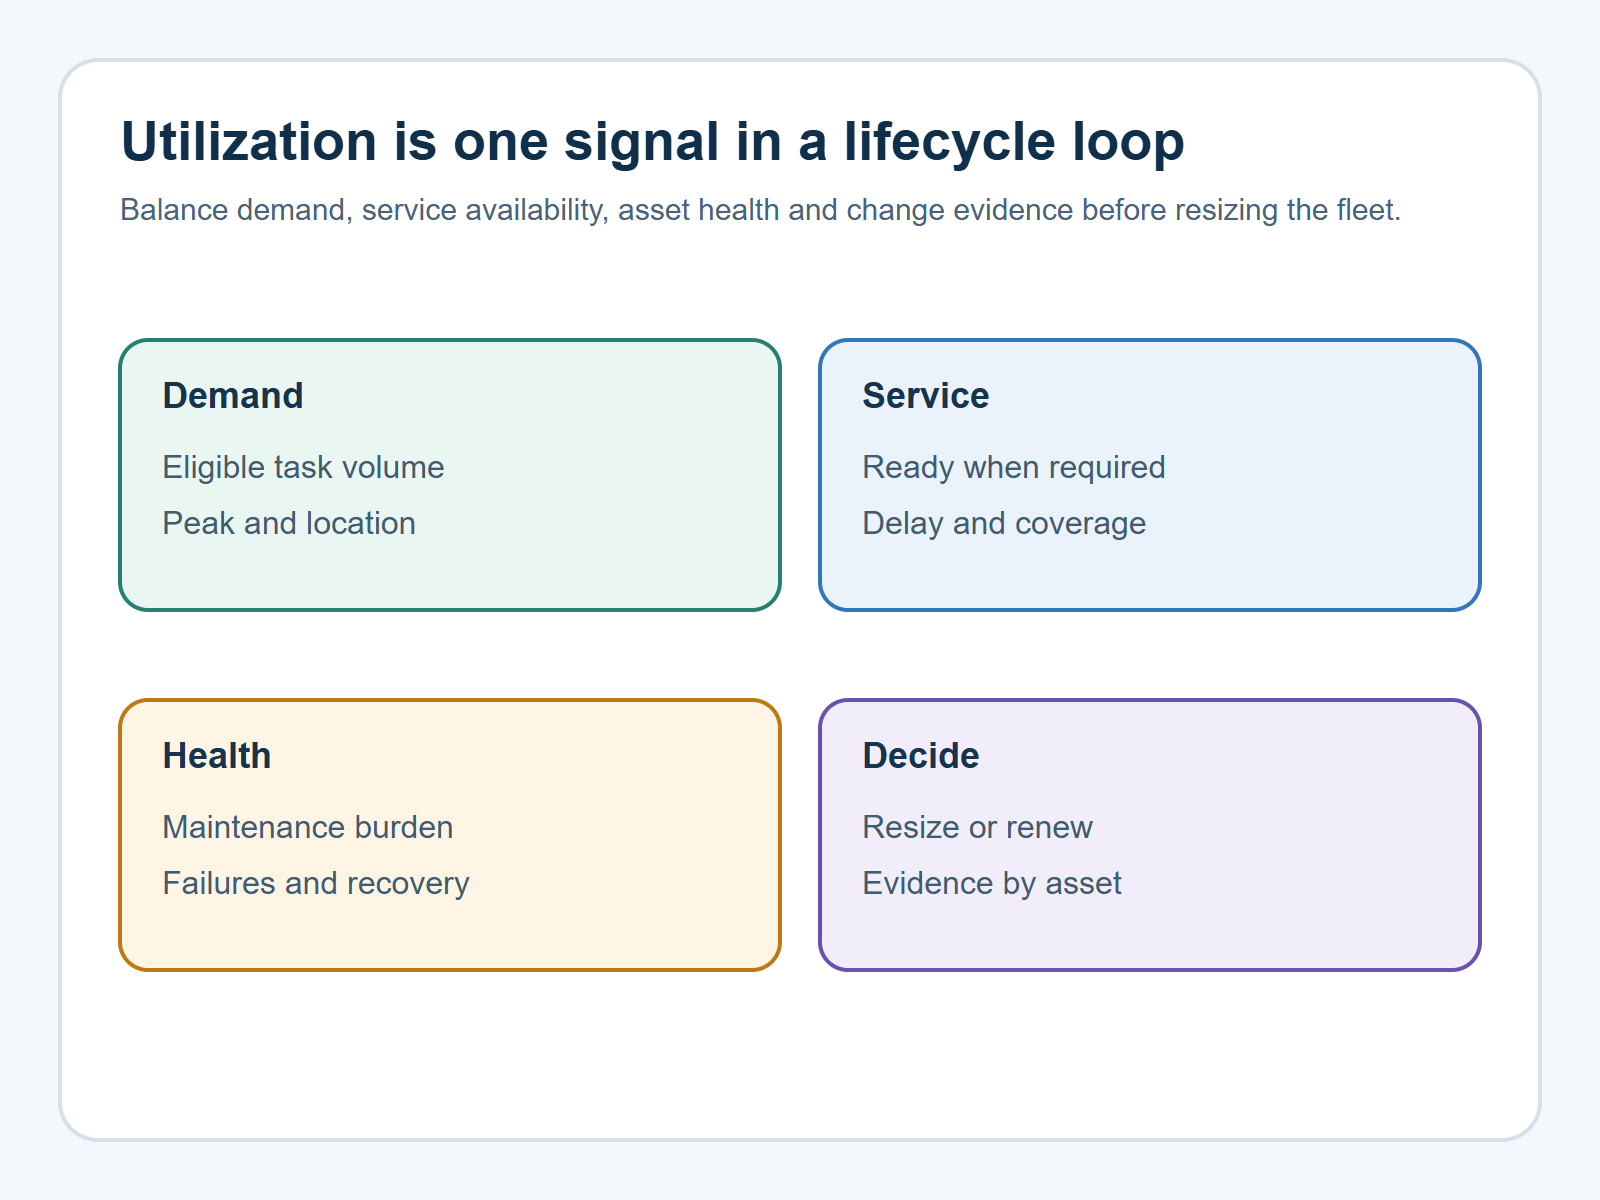
A useful operating model connects demand, service availability, productive work, interventions, asset health and lifecycle cost. Utilization informs a decision; it is not the decision by itself.
Define the clock and the service denominator
Decide what time is in scope. Calendar time, contracted service hours, staffed operating windows and eligible demand windows answer different questions. Exclude planned shutdowns only when the contract and operating model treat them as out of scope—and report the excluded time separately.
Segment productive time, repositioning, charging, planned maintenance, unplanned downtime, blocked waiting, demand waiting and unavailable time. A single “idle” bucket hides whether the issue is insufficient demand, poor scheduling, a site constraint or an unhealthy asset.
Pair utilization with service outcomes
Track eligible demand served, queue age, on-time completion, missed missions, manual substitution and peak coverage. High utilization with growing queues can indicate insufficient capacity. Low utilization with excellent service may be intentional resilience or simply excess fleet; demand and cost evidence decide which.
Measure distributions by site, shift, zone, task class and asset. Averages conceal stranded robots and local bottlenecks. Preserve the reason a task was ineligible or cancelled so optimization does not improve the metric by shrinking its denominator.
Treat maintenance as value protection
ISO 55000 frames asset management around realizing value from assets in support of organizational objectives. Apply that lifecycle view to RaaS: maintenance, upgrades and replacement should protect service, safety, risk and total value—not merely maximize operating hours.
Track planned versus unplanned work, mean time to recover, repeat failure, parts consumption, remote resolution, technician travel and maintenance-induced unavailability. Where servicing can expose people to hazardous energy, apply the organization’s qualified safety procedures and applicable requirements; a utilization target must never pressure technicians to bypass controls.
Maintain asset and configuration lineage
Know which hardware revision, battery, safety configuration, software release, map and integration version each asset used during every evidence period. Without configuration lineage, a reliability trend can mix materially different states and lead to the wrong replacement or rollout decision.
Record component swaps, firmware updates, damage, repair, redeployment and decommissioning. Tie incidents and service outcomes to the asset state at the time, while controlling access to customer and operational data.
Use a balanced fleet review
Scroll horizontally to compare all columns.
| Question | Primary evidence | Avoid this shortcut |
|---|---|---|
| Is capacity sufficient? | Demand, queues, peak coverage and substitutions | Utilization average alone |
| Is the fleet healthy? | Availability, failures, recovery and repeat work | Counting only completed missions |
| Should an asset move? | Demand by zone and transition cost | Moving the least-used unit automatically |
| Should an asset renew? | Risk, supportability, cost and service impact | Age threshold alone |
Turn metrics into explicit lifecycle decisions
Use a regular review with defined authorities. Possible decisions include rebalance tasks, adjust service windows, change charging strategy, move an asset, add capacity, retire capacity, perform corrective maintenance, upgrade a component or investigate data quality. Each decision should cite the evidence and expected effect.
Set guardrails: minimum service availability, maximum queue or substitution level, critical safety conditions, maintenance compliance and customer experience. A cost or utilization improvement that breaches a guardrail is not an acceptable optimization.
Align provider and customer responsibilities
The customer usually controls demand, workflow release and site conditions; the provider controls agreed fleet service, monitoring, maintenance and technical recovery. Integration, data, change and incident responsibilities may be shared. Put each operating question in a responsibility matrix with one accountable owner.
Review definitions with commercial terms. If the contract measures availability differently from operations, teams will optimize conflicting numbers. Keep raw evidence and exclusions reviewable so both parties can resolve disputes without reconstructing the month from screenshots.
Use Warpify’s RaaS solution approach with the RaaS pricing model and RaaS responsibility matrix. When service objectives and evidence are aligned, design your RaaS operating model.

Iven Wang
Iven Wang is the Co-Founder of Warpify Robotics, specializing in the commercialization and deployment of robotic solutions. With a background in electrical engineering and product management, he works with manufacturers, integrators, and enterprise clients across industrial inspection, security, logistics, and Robotics-as-a-Service.
Subscribe to our newsletter today
Get practical robotics deployment insights, case studies, and planning guidance from Warpify Robotics.